Analytics with Incanter
These past few days I've been playing with Incanter, which is a Clojure-based, R-like platform for statistical computing and graphics. This post covers the basic steps of using Clojure to access your Google Analytics Data with the Google Analytics Data Export API and visualize, filter the data returned using Incanter.
Google provides a Java library to simplify use of any Google Data API with Java, to access Analytics you need to grab the following list of Jars from gdata-java-client and google-collections.
- gdata-client-1.0.jar
- gdata-client-meta-1.0.jar
- gdata-core-1.0.jar
- gdata-analytics-2.1.jar
- gdata-analytics-meta-2.1.jar
- google-collect-1.0.jar
After running "lein deps" add them to the lib/ subdirectory.
(ns analytics.core
  (:use incanter.core)
  (:use incanter.charts)
  (:import (java.net URL)
           (com.google.gdata.client.analytics AnalyticsService DataQuery)))

(defn get-class [class]
  (Class/forName (str "com.google.gdata.data.analytics." class)))

(defn service [username pass]
  (doto (AnalyticsService. "Clojure_Incanter_Sample")
    (.setUserCredentials username pass)))
In order to retrieve data we need a service object which handles all interaction between our application and Analytics Data Export API.
(defn account-feed [service & args]
  (let [url (URL. (str "https://www.google.com/analytics/"
                       "feeds/accounts/default?max-results=50"))
        feed (.getFeed service url (get-class "AccountFeed"))
        accs (reduce #(assoc %1
                        (-> %2 .getTitle .getPlainText)
                        (-> %2 .getTableId .getValue))
                     {} (.getEntries feed))]
    (if (nil? args) accs (accs (first args)))))
To retrieve data for a profile, we need its table id. Asking service for an account feed, returns a list of entries containing title, table id and profile id but we are only interested in title and table id.
(defn query [args]
  (let [ga-str (fn[s] (apply str (interpose "," (map #(str "ga" %) s))))]
    (doto (DataQuery. (URL. "https://www.google.com/analytics/feeds/data"))
      (.setStartDate (first (:date args)))
      (.setEndDate (last (:date args)))
      (.setDimensions (ga-str (:dimensions args)))
      (.setMetrics (ga-str (:metrics args)))
      (.setSort (str "-" (ga-str (:sort args))))
      (.setMaxResults (:num-result args))
      (.setIds (:id args)))))

(defn data-feed [service & args]
  (let [args (apply hash-map args)
        feed (.getFeed service (.getUrl (query args)) (get-class "DataFeed"))
        cols (map #(str "ga" %) (concat (:dimensions args) (:metrics args)))]
    (map (fn [e]
           (map #(.stringValueOf e %) cols))
         (.getEntries feed))))
As with the account feed, first thing we need to do is build a feed request URL, query function handles that nothing fancy, it just calls a bunch of setters for dimensions, metrics etc. Querying analytics service with a data feed URL returns a list of entries, data-feed maps over them and returns a sequence containing dimensions and metrics we requested.
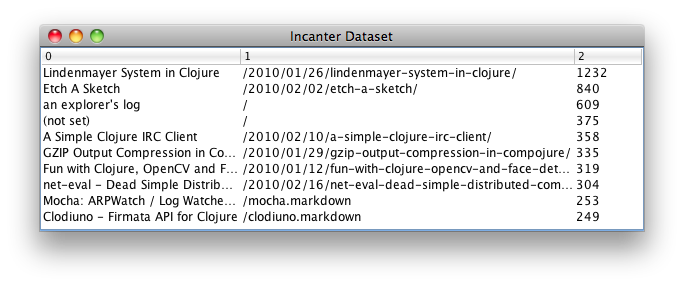
Now that we have some data to play with, we can start off by doing fairly standard things, like which pages got the most visits for the past month,
(def analytics (service "username" "pass"))
(def acc-nakkaya (account-feed analytics "nakkaya.com"))
(def acc-feed (account-feed analytics))

(def pageview (data-feed analytics
                         :date ["2010-01-26" "2010-02-25"]
                         :dimensions [:pageTitle :pagePath]
                         :metrics [:pageviews]
                         :sort [:pageviews]
                         :num-result 10
                         :id acc-nakkaya))
This is where incanter makes things fun, as long as you have a sequence of rows, in this case what data-feed returns you can call view to visualize the data,
(view pageview)
(view (col-names (to-dataset pageview) [:title :path :views]))
or we can filter the data leaving only portions of it which we are interested, such as pages with views more than 200 and lower than 800,
(with-data (col-names (map (fn [[x y z]] [x y (BigInteger. z)]) pageview)
                      [:title :path :views])
  (view ($where {:views {:$gt 200 :$lt 800}})))
Alternatively you can filter the data in Clojure, requesting top 10 keywords people used to find your website and filtering the ones that contain "clojure" or "java" in them,
(def keywords (data-feed analytics
                         :date ["2010-01-26" "2010-02-25"]
                         :dimensions [:keyword]
                         :metrics [:visits]
                         :sort [:visits]
                         :num-result 10
                         :id acc-nakkaya))

(let [words ["clojure" "java"]]
  (reduce (fn[h v]
            (if (some true? (map #(.contains (first v) %) words))
              (conj h v) h)) [] keywords))
analytics.core=> [("clojure xml" "62") ("clojure turtle graphics" "31")
                  ("clojure opencv" "26") ("detect faces from webcam+java" "26")]
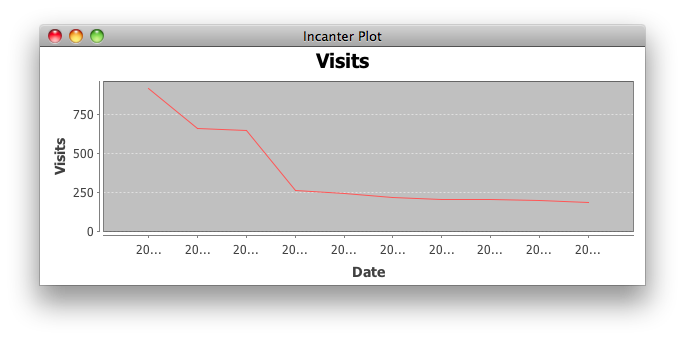
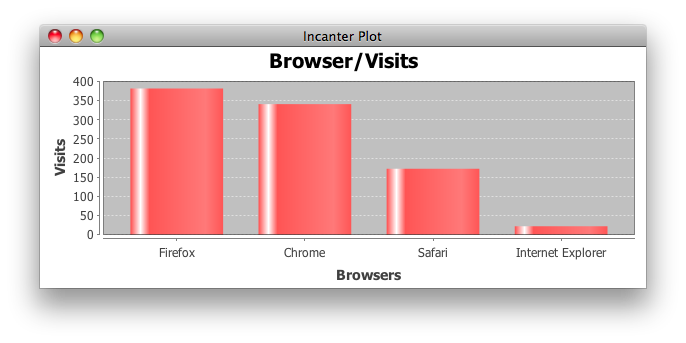
Besides visualizing stuff using tables, we can plot graphs containing the information we are interested,
(def browsers (data-feed analytics
                         :date ["2010-01-26"]
                         :dimensions [:browser]
                         :metrics [:visits]
                         :sort [:visits]
                         :num-result 10
                         :id acc-nakkaya))

(view (bar-chart (take 4 (map first browsers))
                 (take 4 (map #(BigInteger. (last %)) browsers))
                 :title "Browser/Visits"
                 :x-label "Browsers"
                 :y-label "Visits"))
(def view-date (data-feed analytics
                          :date ["2009-11-26" "2010-02-25"]
                          :dimensions [:date]
                          :metrics [:visitors]
                          :sort [:visitors]
                          :num-result 10
                          :id acc-nakkaya))

(view (line-chart (map first view-date)
                  (map #(BigInteger. (last %)) view-date)
                  :title "Visits"
                  :x-label "Date"
                  :y-label "Visits"))