Hilbert Curve
The other day, I came across this, a visualization of the Internet address space. Where they ping all the IP addresses in the IP v4 space and plot a table depending on the response from the server, they draw the graph using a fractal called a Hilbert Curve, following uses my turtle graphics implementation to draw the curve.
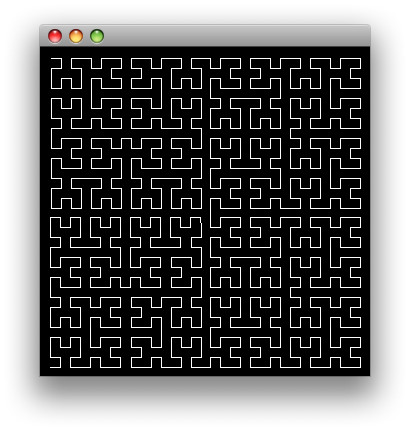
(ns hilbert
  (:use turtle))

(def size 10)
(def width 330)
(def height 330)

(defn hilbert [turtle level angle]
  (if (> level 0)
    (doto turtle
      (right angle)
      (hilbert (dec level) (- angle))
      (forward size)
      (left angle)
      (hilbert (dec level) angle)
      (forward size)
      (hilbert (dec level) angle)
      (left angle)
      (forward size)
      (hilbert (dec level) (- angle))
      (right angle))))

(let [turtle (turtle width height)]
  (doto turtle
    (pen-up)
    (go (- 10 (/ width 2)) (- 10 (/ height 2)))
    (pen-down)
    (hilbert 5 90)
    (show)))