Visualizing Maps Using Incanter
When I first saw Mathematica's WorldPlot function I was impressed, its a nice way to visualize various forms of geographical data, for some time I thought this should be a very labor intensive task, who would go around labeling each pixel. Couple of days ago I somehow ended up reading the Processing article on Wikipedia, it contains an example which shows a map of the results of the 2008 USA presidential election, turns out using Scalable Vector Graphics implementing WorldPlot functionality is extremely easy.
We will be plotting how population moved between different regions in Turkey (in to and out of a region). I am using data provided by The Turkish Statistical Institute, you can grab the map I used from Wikipedia here.
(ns worldplot.core
  (:use [incanter core processing]))

;; Data for 2009
(def pop-taken [{:id 1 :name "Marmara" :population 582771}
                {:id 2 :name "Iç Anadolu" :population 297919}
                {:id 3 :name "Ege" :population 164896}
                {:id 4 :name "Akdeniz" :population 188441}
                {:id 5 :name "Karadeniz" :population 256654}
                {:id 6 :name "Güneydoğu Anadolu" :population 171910}
                {:id 7 :name "Doğu Anadolu" :population 214082}])

(def pop-given [{:id 1 :name "Marmara" :population 677395}
                {:id 2 :name "Iç Anadolu" :population 310293}
                {:id 3 :name "Ege" :population 181459}
                {:id 4 :name "Akdeniz" :population 193231}
                {:id 5 :name "Karadeniz" :population 247397}
                {:id 6 :name "Güneydoğu Anadolu" :population 118611}
                {:id 7 :name "Doğu Anadolu" :population 148287}])
Turkey is divided in to seven geographical regions, pop-taken represents how many people moved in to that particular region and pop-given represents how many people moved out of that region during 2009.
(defn region-color [val min max]
  (lerp-color (color 0xffd120) (color 0x920903) (norm val min max)))
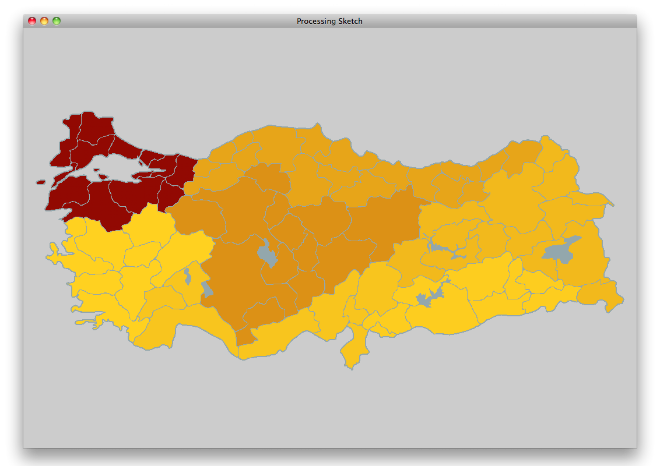
In order to paint the map like a heat map, we need to assign colors using the amount of people moved in or out of a region, given a min, max and a value in between norm will normalize a value to exist between 0 and 1, lerp-color on the other hand will calculate a color between the given range using the normalized value. So our map will go from yellow to dark red depending on the people moved.
(defn map-region-color [regions]
  (let [min (apply min (map #(:population %) regions))
        max (apply max (map #(:population %) regions))]
    (map #(vector (:id %) (region-color (:population %) min max)) regions)))
Now all we need to do is calculate min and max values in the data set, iterate over the data set and return a sequence of [id color] pairs.
(defn sktch [regions]
  (sketch
   (setup [])
   (draw
    []
    (let [tr-map (load-shape this "MapTurkishProvincesNumbers.svg")]
      (.shape this tr-map 0 0)
      (doseq [region (map-region-color regions)]
        (let [[id color] region
              child (.getChild tr-map (str id))]
          (.disableStyle child)
          (.fill this color)
          (.noStroke this)
          (.shape this child 0 0)
          no-loop))))))
Using incanter-processing library, we can load and access parts of the SVG map. Processing sketches are made up of the functions setup and draw, in setup as its name suggests you setup your stuff frame rate, stroke properties etc. Draw will be called once or multiple times depending on your frame rate, we load the map as a shape then paint it on the canvas, then we iterate over the data set, using getChild method of the PShape class we can access parts of the image, the map we are using has 7 children named 1 through 7 corresponding to the geographical regions of the country, we get the child then paint it using the color we calculated on to the canvas. One thing to note, sketch macro just returns a PApplet so for any function not implemented in incanter, you can access them just like any other Java function. Now lets see the results,
(view (sktch pop-given) :size [1052 744])
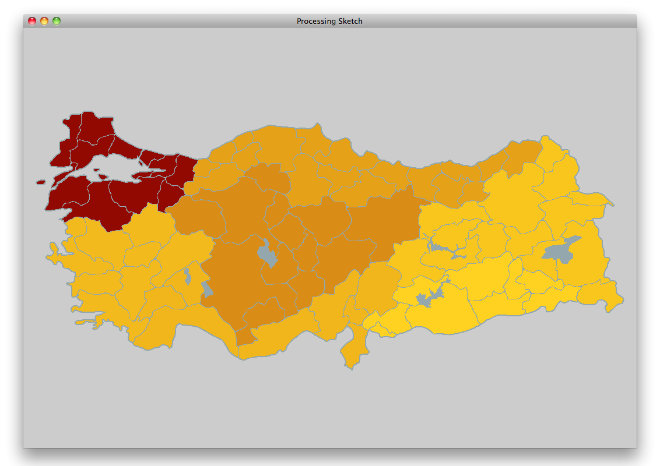
(view (sktch pop-taken) :size [1052 744])