Visualising the Wikileak's war logs using Clojure
Ever since Wikileaks released the Afghan War Diary document set, playing with it was on my list of todo items. Yesterday I had some free time and decided to give it a shot. Data for this post is from the spreadsheets The Guardian posted which is used for their own visualisations, I only moved columns around so that I can read stuff easier on the Clojure/Incanter side.
(ns afgan.core
  (:use [incanter core charts excel])
  (:import (org.jfree.chart.axis CategoryLabelPositions)
           (javax.swing JFrame JLabel)
           (java.io File)
           (javax.imageio ImageIO)))

(def total-casualties (read-xls "war-log.xls" :sheet 0))
(def ied-month (read-xls "war-log.xls" :sheet 1))
(def ied-region (read-xls "war-log.xls" :sheet 2))
(def lat-long-deaths (read-xls "war-log.xls" :sheet 3))
(def lat-long-woundings (read-xls "war-log.xls" :sheet 4))
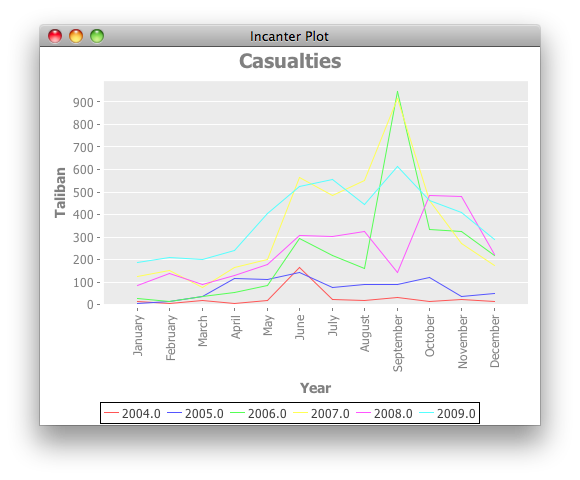
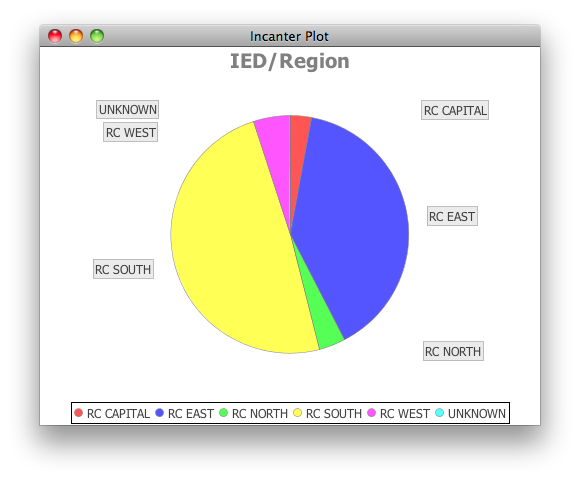
Sheet zero contains casualty data for Taliban/Civilian/Afghan/Nato Forces by month, sheet one contains IED explosions and IED ambush and those found and cleared, by month, sheet two contains regional breakdown of IED attacks and ambushes, sheets three and four contains coordinates for death and wounded.
Starting with the obvious,
(def taliban-casualties
     (doto (line-chart (sel total-casualties :cols 1)
                       (sel total-casualties :cols 2)
                       :group-by (sel total-casualties :cols 0)
                       :title "Casualties"
                       :legend true
                       :y-label "Taliban"
                       :x-label "Year")
       (-> .getPlot .getDomainAxis (.setCategoryLabelPositions
                                    CategoryLabelPositions/UP_90))))
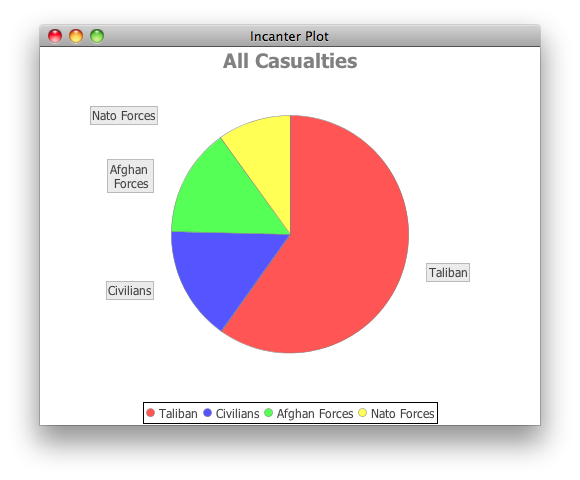
(def all-casualties
     (let [sum-not-nil #(apply + (filter (fn[v] (not (nil? v))) %))
           taliban (sum-not-nil (sel total-casualties :cols 2))
           civilian (sum-not-nil (sel total-casualties :cols 3))
           afghan (sum-not-nil (sel total-casualties :cols 4))
           nato (+ (sum-not-nil (sel total-casualties :cols 5))
                   (sum-not-nil (sel total-casualties :cols 6)))]
       (pie-chart ["Taliban" "Civilians" "Afghan Forces" "Nato Forces"]
                  [taliban civilian afghan nato]
                  :title "All Casualties"
                  :legend true)))
(def ied-region (let [dat (to-map ied-region)]
                  (pie-chart (filter #(not(nil? %)) (:Region dat))
                             (filter #(not(nil? %)) (:Total dat))
                             :title "IED/Region"
                             :legend true)))
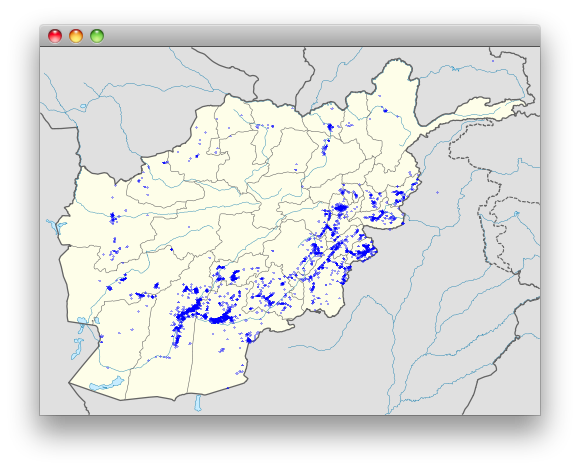
Here comes the tricky part, marking latitudes and longitudes on a map. There are various map projections with different usages, and specific advantages and disadvantages (for more info read this), the one we will be using is called Equirectangular projection. With this projection latitudes and longitudes can be mapped directly onto the cartesian coordinate system. Wikipedia has a map of Afghanistan that uses Equirectangular projection covering,
- N: 38.8° N
- S: 29.0° N
- W: 60.0° E
- E: 75.3° E
To calculate the location of a coordinate on the image all we need to do is map the longitude which is in a range 60.0/75.3 to a number between 0 and width we do the same for the latitude and we have a X,Y coordinate to paint.
(defn map-number [x in-min in-max out-min out-max]
  (+ (/ (* (- x in-min) (- out-max out-min)) (- in-max in-min)) out-min))

(defn to-pixel [long lat width height]
  [(map-number long 60.0 75.3 0 width) (map-number lat 38.8 29.0 0 height)])
Incanter imports empty cells as nil those needs to be removed from the data set and we calculate the biggest number of Death/Wounded in the set which decides how big of a circle we draw on the coordinate,
(defn prepare-data [data key]
  (reduce (fn[h v]
            (let [long (v "Longitude") lat  (v "Latitude") num (v key)]
              (if (and (not (nil? long)) (not (nil? lat)) (> num 0))
                (conj h [long lat num]) h))) [] (:rows data)))

(defn all-deaths []
  (let [data (prepare-data lat-long-deaths "Deaths")
        max (apply max (map #(nth % 2) data))]
    [data max]))

(defn all-woundings []
  (let [data (prepare-data lat-long-woundings "Woundings")
        max (apply max (map #(nth % 2) data))]
    [data max]))
All thats left to do is to iterate the data set and paint,
(defn circle [g [x y] rad]
  (let [offset (int (/ rad 2))
        x (- x offset)
        y (- y offset)]
    (.fill g (java.awt.geom.Ellipse2D$Double. x y rad rad))))

(defn draw [width height graphics data]
  (let [[data max] data
        points (map #(let [[long lat num] %]
                       [(to-pixel long lat width height) num]) data)]
    (.setColor graphics (java.awt.Color. 0 0 255 100))
    (doseq [[cord num] points]
      (circle graphics cord (map-number num 1 max 3 10)))))

(defn frame [data]
  (let [image  (ImageIO/read (File. "afghan.png"))
        canvas (proxy [JLabel] []
                 (paintComponent [g] (.drawImage g image 0 0 this))
                 (getPreferredSize[] (java.awt.Dimension.
                                      (.getWidth image)
                                      (.getHeight image))))]
    (draw (.getWidth image) (.getHeight image) (.createGraphics image) data)
    (doto (JFrame.)
      (.add canvas)
      (.pack)
      (.show))))
All deaths,
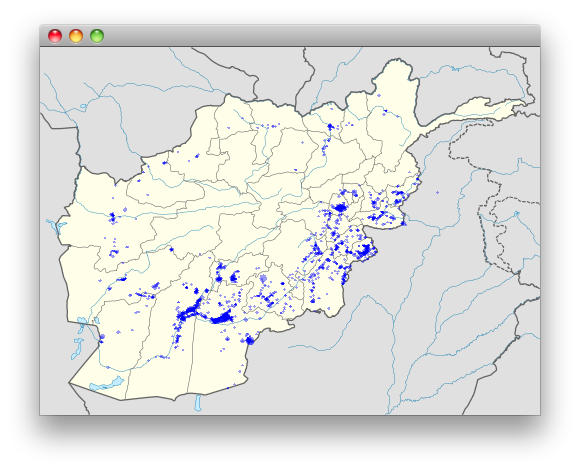
All woundings,